Hamza Salah

Data Science (M.S. graduate), passionate about building ML and forecasting solutions across diverse domains.
![]()
![]()
![]()
![]()
Predictive Modeling of Tennessee Energy Demand
Project Overview
This project, Tennessee Energy Insights, analyzes electricity consumption in Tennessee across residential, commercial, industrial, and combined sectors from 2010–2024.
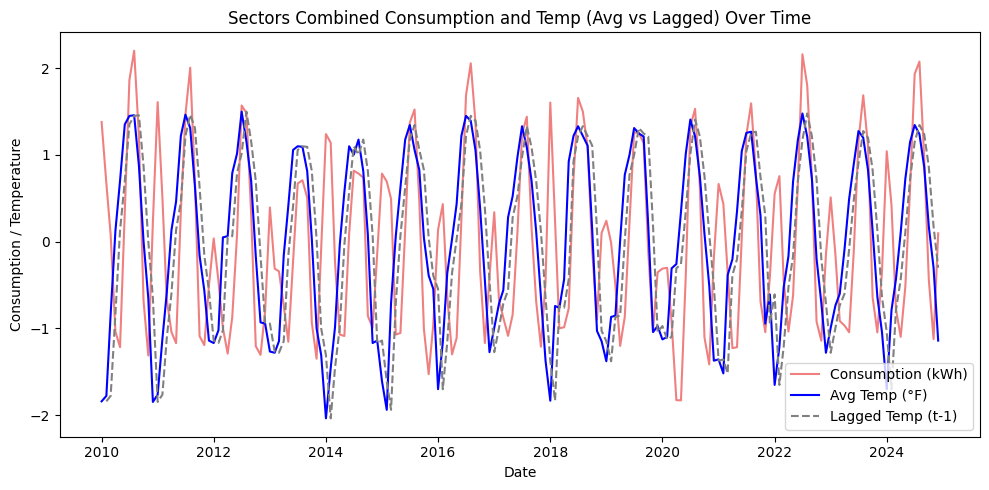
The focus is on understanding how average temperature and electricity pricing drive demand and building predictive models for more accurate forecasting.
By uncovering seasonal patterns and external drivers, the study provides actionable insights for policymakers, utility companies, and community planners to manage resources efficiently, especially as new infrastructure and climate variability increase demand pressures.
Key Insights
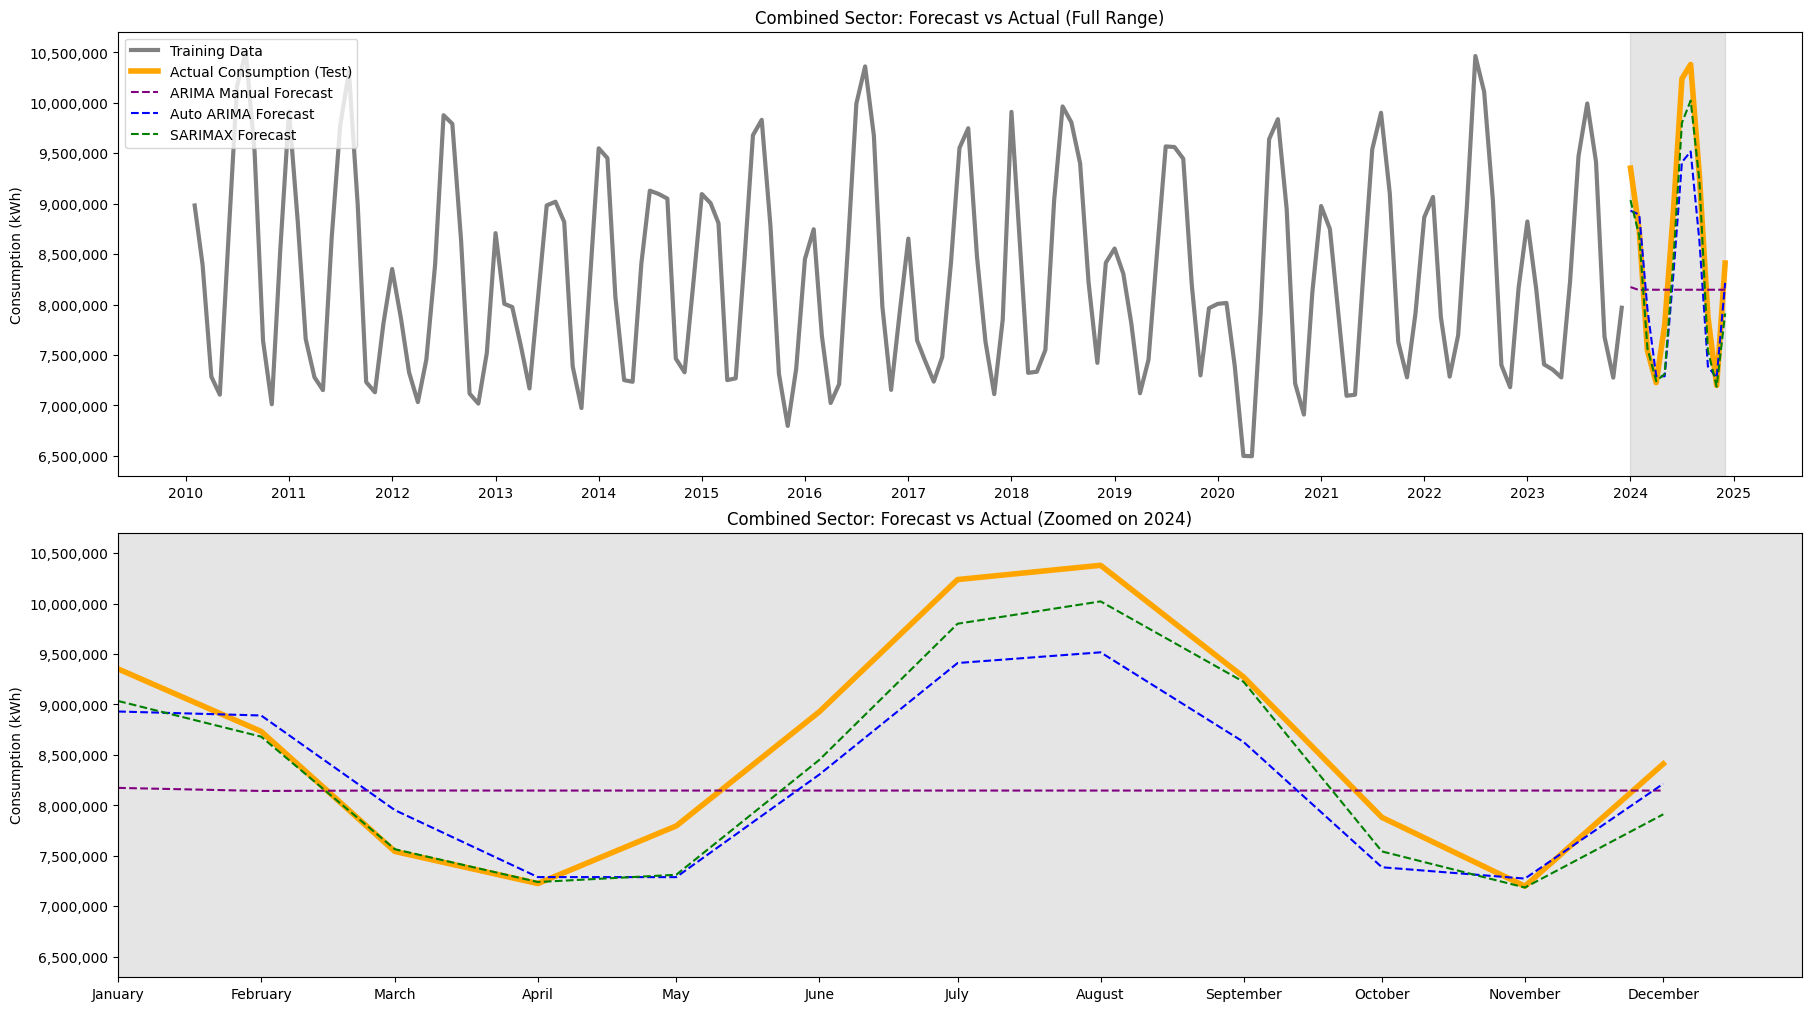
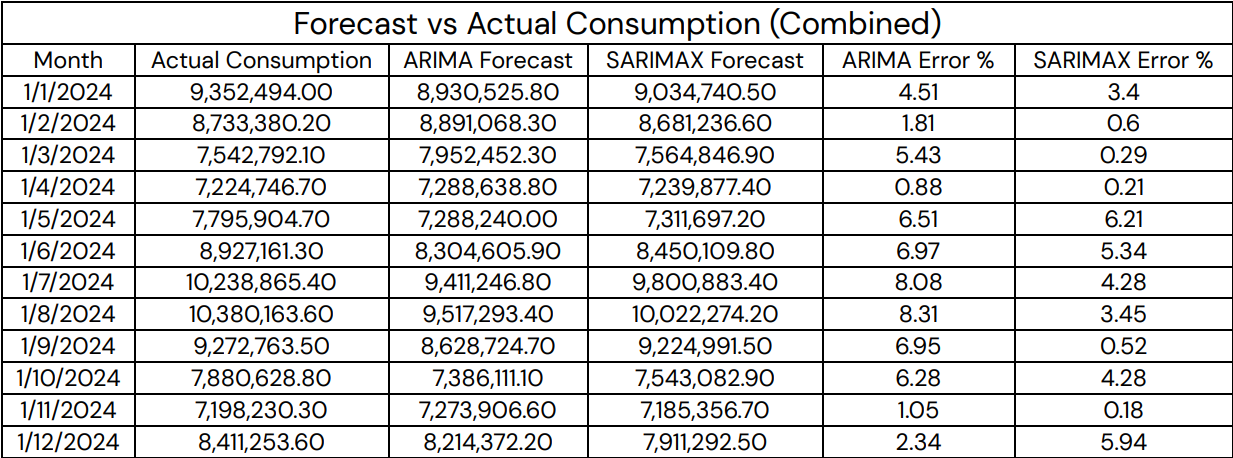
- SARIMAX consistently outperformed ARIMA across all sectors with lower MAE, RMSE, and MAPE.
- Residential MAPE: 5.69% (SARIMAX) vs. 6.82% (ARIMA)
- Commercial MAPE: 2.02% vs. 3.50%
- Industrial MAPE: 4.10% vs. 8.14%
- Combined MAPE: 2.89% vs. 4.93%
- Residential & Commercial demand is highly seasonal, strongly influenced by temperature (especially HVAC usage).
- Industrial demand shows a steady decline post-2014, suggesting efficiency gains independent of weather.
- Transportation data was too incomplete for meaningful modeling.
- Recommendations include customer alerts for peak demand, incentives for efficiency, industrial sector support, and better transportation data collection.
Code and Data
- Datasets:
- Monthly electricity consumption (EIA, 2010–2024)
- Monthly average temperatures (NOAA, 2010–2024)
- Cleaning and Prep:
- Merged datasets by date
- Created sector-level subsets (Residential, Commercial, Industrial, Combined)
- Standardized consumption & temperature variables
- View Full Notebook on GitHub
- Data sources: EIA.gov, NOAA Climate Data
Visualizations
Technologies Used
- Python (Pandas, NumPy, Scikit-learn, Statsmodels, pmdarima)
- Jupyter Notebook
- Matplotlib, Seaborn for visualization
- Tableau for interactive exploration