Hamza Salah

Data Science (M.S. graduate), passionate about building ML and forecasting solutions across diverse domains.
![]()
![]()
![]()
![]()
Data Science Portfolio
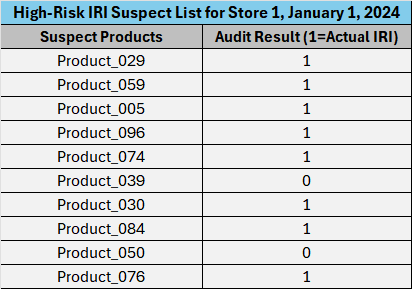
Click to explore key insights of real-world data case studies focused on inventory optimization, risk management, and forecasting.Predictive Modeling of Retail Inventory Inaccuracy (IRI) for Audit Prioritization


Developed a Logistic Regression model to forecast Inventory Record Inaccuracy (IRI) risk. The model achieved an F1-Score of 0.83 on this dataset, demonstrating how predictive analytics can prioritize audit workflows.
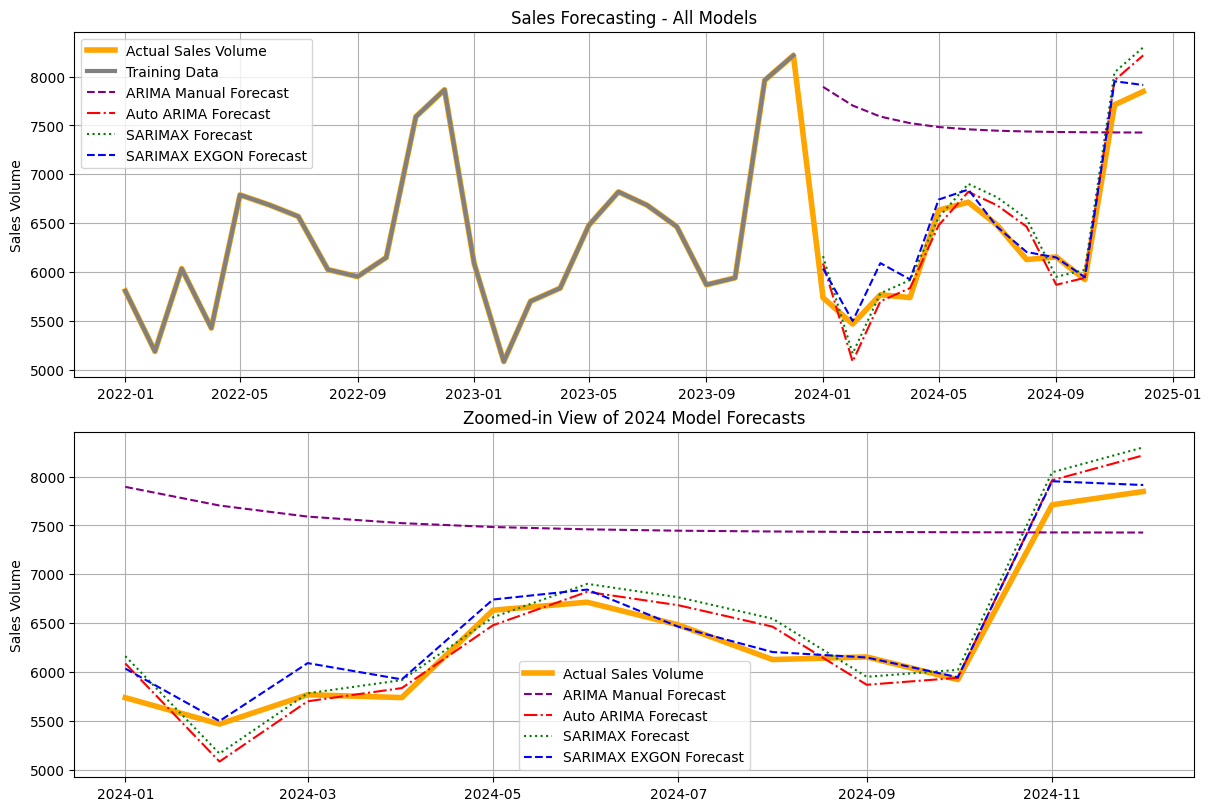
Retail Demand Forecasting


Forecasted retail product demand using ARIMA, Auto ARIMA, and SARIMAX models to identify seasonal and promotional trends. Achieving a low RMSE to help with optimizing inventory management, reducing overstocking, and improving retail profitability.
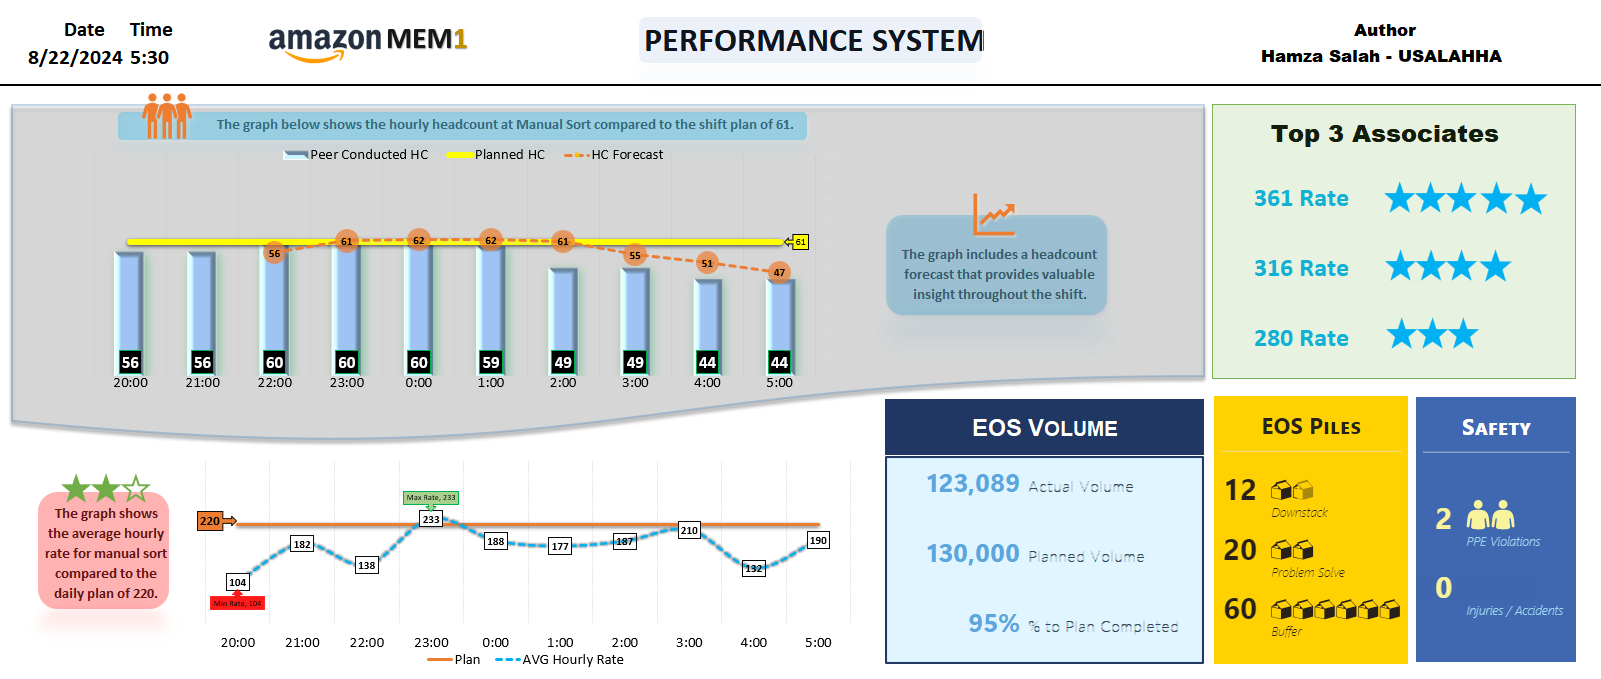
Amazon Fulfillment Center Optimization Tool

I developed a comprehensive Employee Performance System to aid the Amazon OPS team in tracking and improving productivity for a department of 300+ employees. This advanced Excel-based tool acts as a central hub for performance analytics, automating the ingestion of raw data using Power Query and utilizing complex formulas to forecast headcount needs.
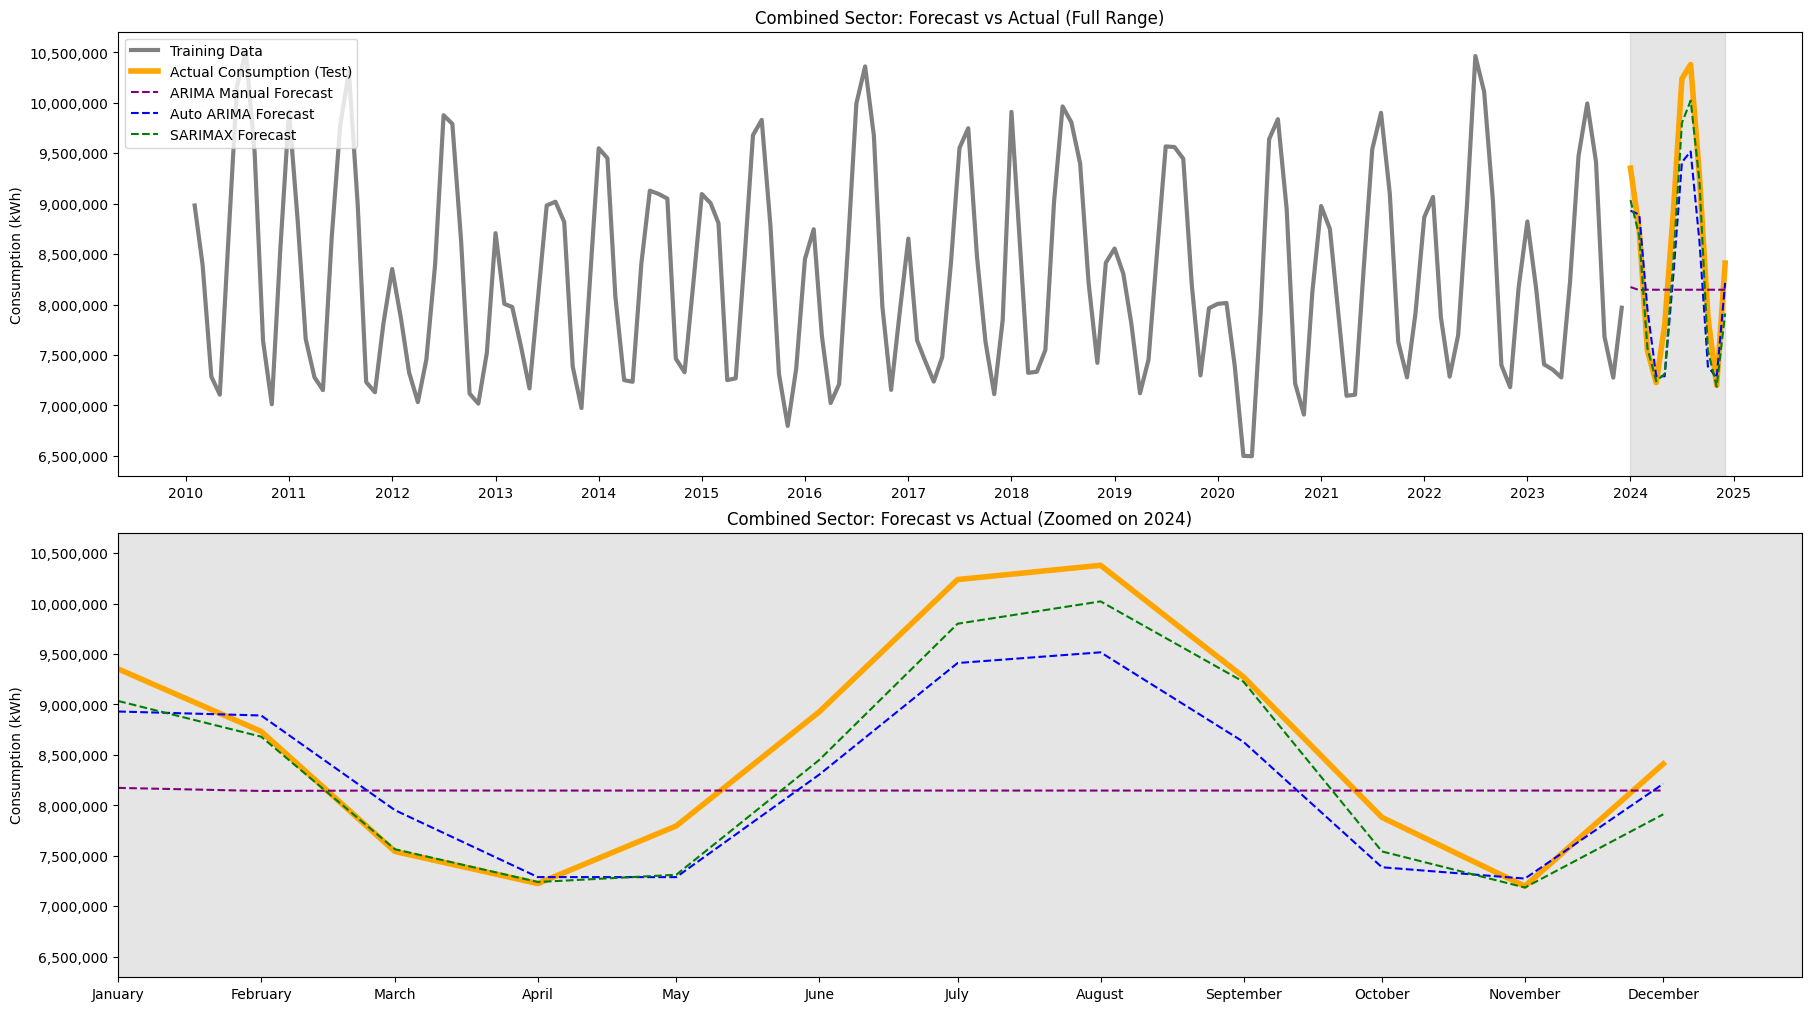
Predictive Modeling of Tennessee Energy Demand
Forecasted Tennessee electricity demand for 2025 using SARIMAX and regression models, uncovering sector-specific consumption trends and achieving up to 97% forecast accuracy.
Sentiment Analysis of Customer Reviews

Analyzed Amazon product reviews using NLP techniques. Preprocessed review text, extracted features, and applied ML models to classify reviews as positive or negative.
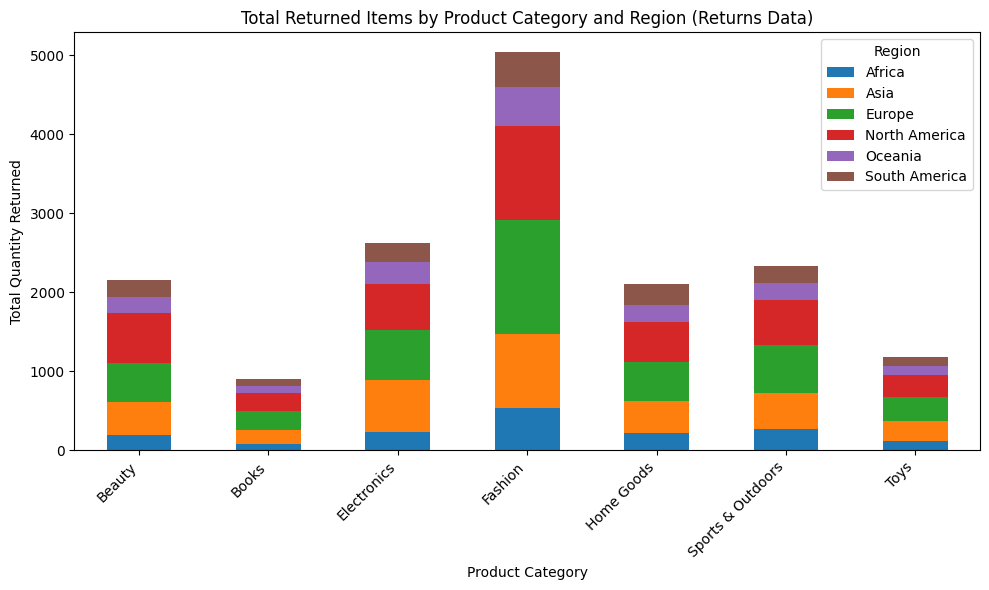
Return Prediction in E-commerce: Modeling of Key Risks

Developed and evaluated a Logistic Regression model to predict product returns in e-commerce. The model achieved a valuable Recall of 60% for the minority class (Returns), enabling the business to manage return risk proactively. The strongest risk drivers identified were the Cash payment method and weekend orders (Friday, Saturday, Sunday).
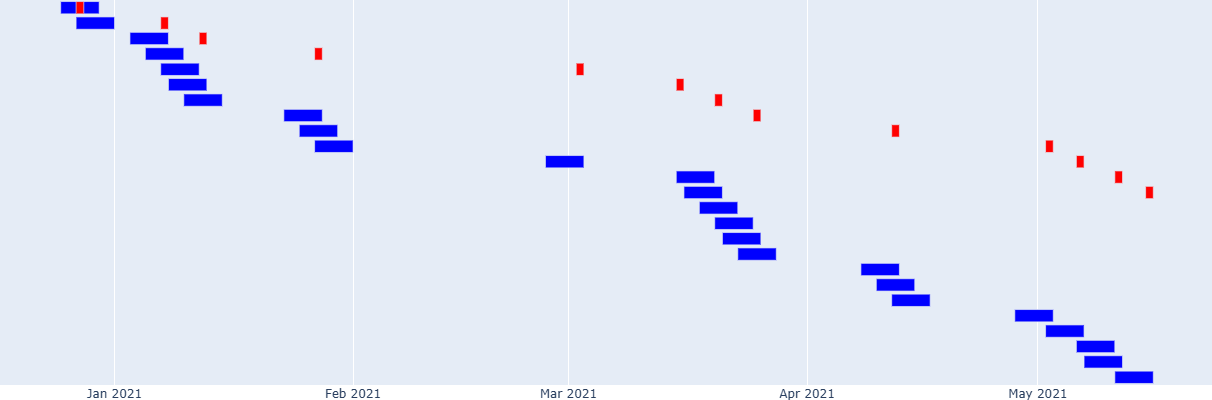
Operational Schedule & Performance Analysis

This project analyzes high-frequency NBA schedule data (2014–2025) to model the impact of schedule density and tight turnaround times on performance output. By identifying “crunch” periods like back-to-backs and 4-events-in-6-days, the system forecasts fatigue risks and quantifies performance degradation. The analysis ranks schedule difficulty and demonstrates how deeper resource allocation (rotations) mitigates efficiency loss during peak operational windows.
BI & Visualization Suite


A collection of interactive dashboards and databases built with Tableau, Power BI, and SQL to derive insights across various domains.
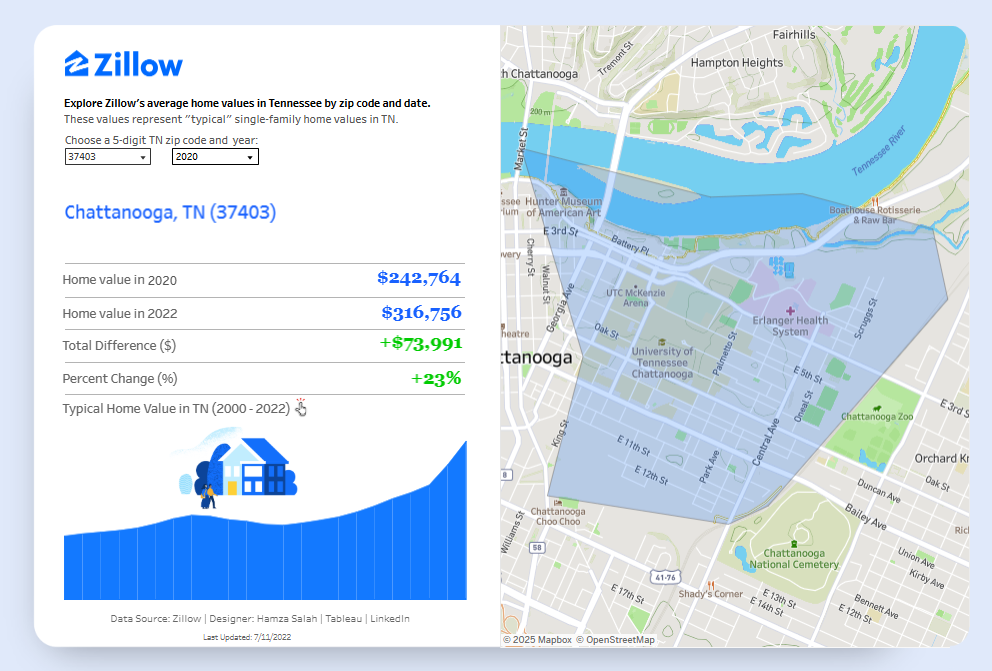
- Tennessee Home Values Dashboard (Tableau): Tracks single-family home values in Tennessee, highlighting trends and county-level growth rates.
- Hospital COVID-19 Relational Database (SQL): Designed a relational database to manage hospital data, including a user interface for staff.

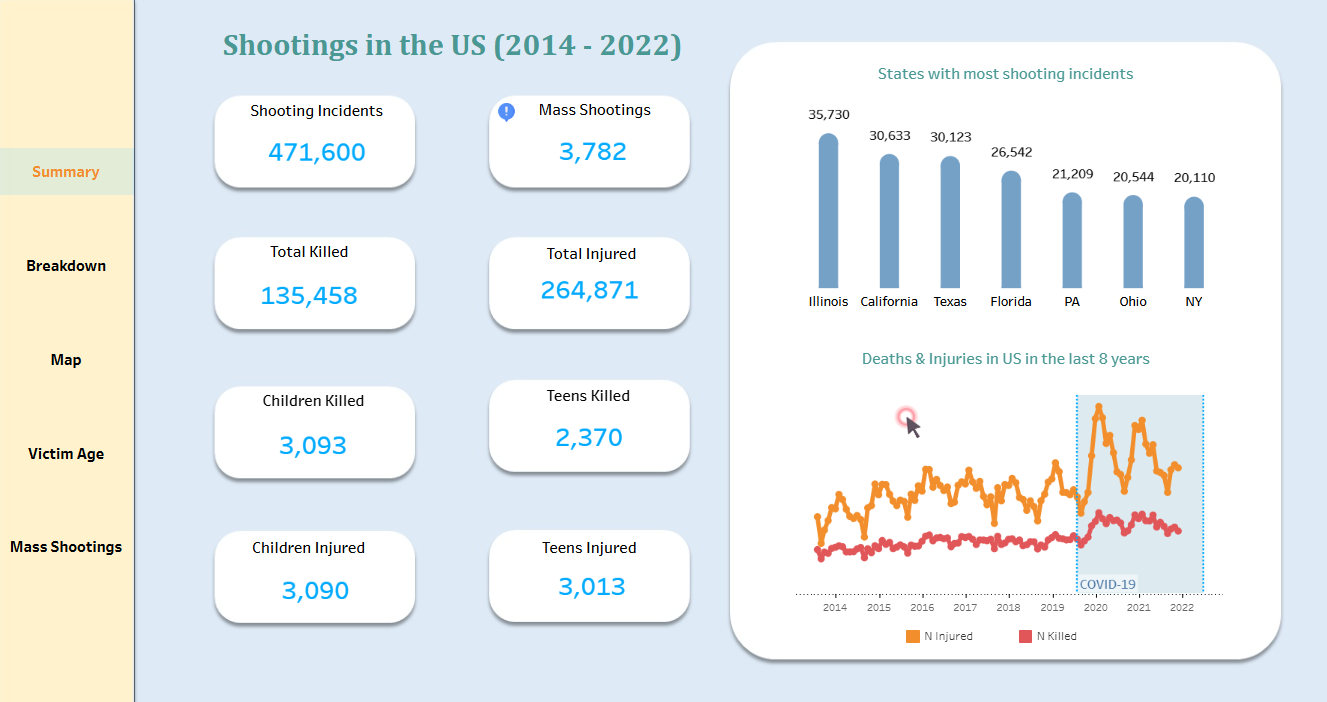
- U.S. Public Safety Trend Analysis (Tableau): Visualized geographic hotspots in urban areas and uncovered incident trends linked to lockdown stressors.
- Empowering Mothers: Workforce Analysis (Power BI): Visualized the impact of childcare costs on workforce participation and gender disparities.
- Additional Dashboards: